How to reduce AI agent cost: three levers, measured
How to reduce AI agent cost: cache the prefix and prove it hits, lower the effort, pick the model by cost per task. 21 measured runs, $0.150 down to $0.058.
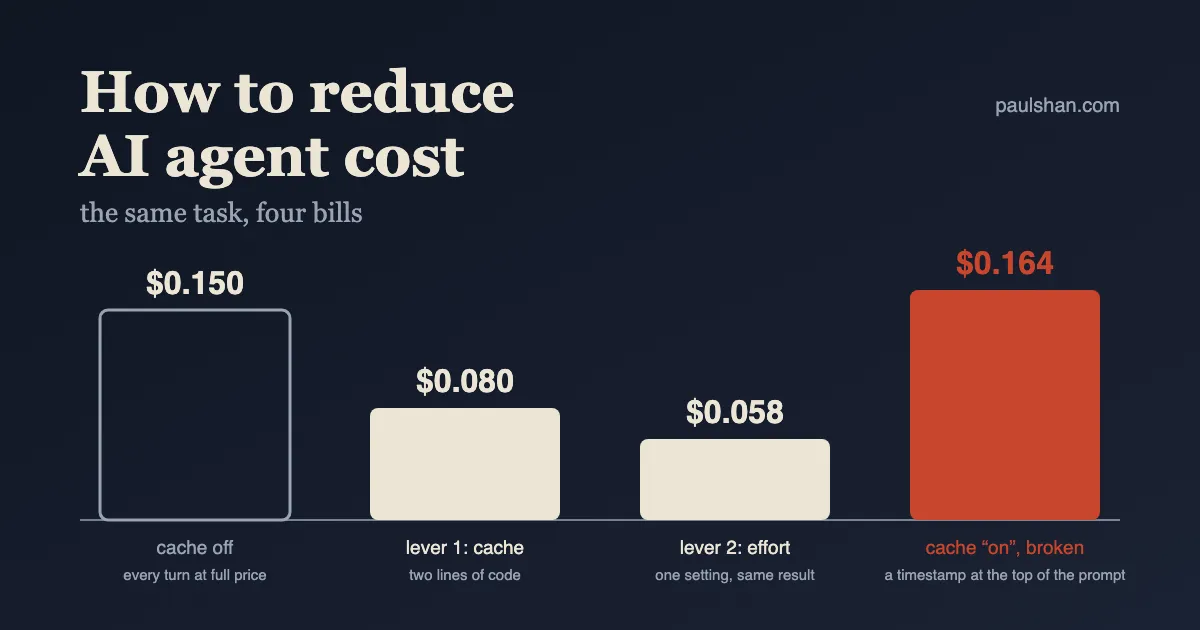
In my essay on context engineering, the last of the nine mistakes was putting changing content at the top of the prompt. I wrote that it was really about cost and left it for later. This is later. The harness I’ve used through this series had never cached a single token, and every dollar figure I’d printed was paid at full price. So I took the same task, applied the cost levers one at a time, broke one on purpose, and measured each step: 21 runs, every token counted from the API’s own meter. The levers come in an order, and the order is the point. One assumption up front: tool output is already capped. That lever alone took a task from $1.01 to $0.03 in my tool design essay, and it belongs before any of these. The three below are what’s left once it’s done.
Where an AI agent’s cost comes from: the re-reading
An AI agent’s cost is dominated by re-reading, because the loop that makes it an agent resends the entire conversation on every turn, so a session’s bill grows with the square of its length, not the length. The model is stateless. Turn 8 carries the system prompt, the tool definitions, and all seven turns before it, just to produce one more step. Most of what you pay for is history the model has already read.
Here’s what that looks like in one real run. Same task as the rest of this series: write a monthly rollup script for a weather station’s readings, run it, check the numbers. Opus 5.5, eight turns, no caching:
turn  input  cacheWrite  cacheRead  output   $ this turn
   1  1,473           0          0      27   $0.0064
   2  1,573           0          0     256   $0.0114
   3  2,850           0          0     225   $0.0159
   4  3,228           0          0     219   $0.0173
   5  3,548           0          0   1,058   $0.0354
   6  4,629           0          0     230   $0.0231
   7  5,419           0          0     309   $0.0279
   8  5,895           0          0     622   $0.0360
                                            ------
      28,615 input · 2,946 output          $0.1734
The input column is the whole conversation so far, and it only goes up. By turn 8 the model is re-reading 5,895 tokens to add a few hundred. Across the run, 91% of the tokens billed were input, and nearly every one of them was a byte the API had already seen on an earlier turn. In dollars the split is less lopsided, because output costs five times more per token: $0.114 of input against $0.059 of output. Still two thirds of the bill, for re-reading. (This is one run, the first of three. The arm’s mean, $0.150, is in the tables below.)
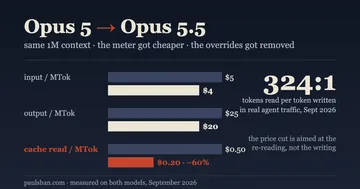
Two things follow. First, the number of turns is the cost of a task, which my agent loop essay measured from the other direction. Second, almost all of those input tokens are identical bytes the API has already processed, which is exactly what a cache is for. Anthropic’s own traffic numbers put the ratio at 324 tokens read for every token written, up from 189:1 six months earlier; I went through those numbers when Opus 5.5 launched and repriced cache reads. This isn’t a Claude-specific shape. OpenAI and Google both bill cached input at a discount for the same reason: in agent traffic, re-reading is the product.
So the levers come in an order. Make the re-reading cheap first, because it’s most of the bill. Then look at what’s left.
Lever 1: cache the prefix
Prompt caching lets the API keep the processed form of a request’s prefix, so the next request that starts with the same bytes pays a fraction of the input price for that part. On Claude you mark where the cacheable part ends with a cache_control breakpoint. The request is rendered in a fixed order, tools first, then the system prompt, then the messages, and everything up to the breakpoint is the cache key.
The prices make the deal clear. A cache write costs 1.25× the normal input price, so it’s 25% more expensive than not caching, once. A cache read costs a tenth of the input price on most Claude models, and a twentieth on Opus 5.5 ($0.20 per million against $4). The break-even is two requests: the second one already saves more than the first one cost. In a loop that runs eight turns, there’s no version of the arithmetic in which caching loses, as long as the cache actually hits.
Adding it to my Node.js harness was two lines. One explicit breakpoint on the system prompt, so the tools and system are a guaranteed read point no matter what happens later, plus the top-level automatic breakpoint, which the API moves forward to the last cacheable block of the growing conversation on every request:
const request = { model, max_tokens: 16000, tools: tools.definitions, messages };
// before: request.system = SYSTEM;
request.system = [{ type: "text", text: SYSTEM, cache_control: { type: "ephemeral" } }];
request.cache_control = { type: "ephemeral" }; // automatic breakpoint, moves with the conversation
Nothing else in the loop changed. The messages array grows exactly as before. Same task, three runs each, Opus 5.5 at its default effort, a deterministic verifier on the output:
| Arm | Pass | Turns | Full-price input | Cache write | Cache read | Output | $ per task |
|---|---|---|---|---|---|---|---|
| cache off, the loop as published | 3/3 | 7.0 | 23,859 | 0 | 0 | 2,740 | $0.150 |
| cache on, the two lines above | 3/3 | 7.3 | 17 | 4,246 | 21,656 | 2,733 | $0.080 |
Caching cut the bill by 47% and changed nothing else. Same pass rate, same number of turns and tool calls, same output length. The input side of the bill went from $0.095 to $0.026: 4,246 tokens written at 1.25× and 21,656 read at a twentieth of the price, in place of 23,859 at full price. The input_tokens column collapsing to 17 is the tell. Nothing was processed at full price except the few bytes after the last breakpoint.
One silent limit before you rely on this. Each model has a minimum prefix size below which a breakpoint does nothing: no error, no write, the field just reads zero. It is 512 tokens on Opus 5 and Opus 5.5, 1,024 on Sonnet 5, and 4,096 on Haiku 4.5. My harness’s tools-plus-system prefix is about 1,380 tokens. Opus 5.5 cached it on the first call. Haiku 4.5 processed the same prefix twice at full price and wrote nothing, because it was under 4,096. Haiku only starts caching once the conversation itself has grown past that line, which in my runs it did by the second or third turn.
Check that the cache is hitting: the per-turn signature
A prompt cache fails silently: the request succeeds, the answer is fine, and the bill is higher. There is no error to catch. The API reports what happened in three fields on every response, input_tokens (paid in full), cache_creation_input_tokens (written, 1.25×) and cache_read_input_tokens (read, 0.05–0.1×), and those three fields are the only proof caching is working. So the second step of lever 1 is to look at them, per turn, and know what healthy and broken look like.
To get a broken run on purpose, I added the classic mistake: Current time: <ISO timestamp> as the first line of the system prompt, regenerated every turn. Then a fourth arm with the same line appended to the tail of the newest user message instead, after the tool results, never edited afterwards.
| Arm | Pass | Turns | Full-price input | Cache write | Cache read | Output | $ per task |
|---|---|---|---|---|---|---|---|
| cache on | 3/3 | 7.3 | 17 | 4,246 | 21,656 | 2,733 | $0.080 |
| cache on, timestamp at the top | 3/3 | 6.3 | 15 | 21,778 | 0 | 2,765 | $0.164 |
| cache on, timestamp at the tail | 3/3 | 7.0 | 28 | 4,578 | 20,691 | 2,865 | $0.084 |
A broken cache cost 9% more than no cache at all. $0.164 against the $0.150 of the never-cached arm. The timestamp arm wrote the whole prefix on every turn and read nothing back in 19 turns across three runs. Every write carries the 25% premium, and with zero reads there’s nothing to earn it back. The agent did identical work. If you’d only looked at the output, or the pass rate, or the turn count, you’d have seen nothing wrong. Here is what the usage fields show, a healthy run against a broken one, one run each where the tables are means of three:
# cache on — the healthy signature: reads grow, writes stay small
turn  input  cacheWrite  cacheRead  output
   1      4       1,469          0      27
   2      2         102      1,469     267
   3      2       1,381      1,571     186
   4      2         311      2,952     180
   5      2         284      3,263   1,091
   6      2       1,114      3,547     273
   7      2         807      4,661     206
   8      2         375      5,468     609   → $0.0907
#
# cache on, timestamp at the top — every turn writes everything, reads nothing
turn  input  cacheWrite  cacheRead  output
   1      4       1,491          0      27
   2      2       1,593          0     256
   3      2       2,870          0     226
   4      2       3,249          0     106
   5      2       3,449          0   1,372
   6      2       5,436          0     205
   7      2       5,811          0     504   → $0.1735
In the healthy run, each turn’s write is roughly what the previous turn added, and the read is everything before it. In the broken run, the write column is the conversation, growing every turn, and the read column never moves. One cacheRead: 0 on turn 2 is all the diagnosis you need. Put that check in a test: the second request of any session must read more than zero, or the build fails.
The same line at the tail cost nothing. Moving the timestamp from the front of the system prompt to the end of the newest user message brought the bill back to $0.084, within noise of plain caching. The model had the same information in both arms. Only the position changed, and the position was worth almost half the bill.
The timestamp is the classic case, but anything that differs between two requests invalidates everything after the point where it differs: a request ID, a user’s name interpolated into the instructions, a tool list that’s built from a set and comes out in a different order, a tool added mid-session. Tools render at position zero, so adding one invalidates the whole cache. Switching models does too, because caches are per model. Two more ways to lose the cache that aren’t about bytes:
Idling past the lifetime. A cache entry lives five minutes by default, measured from the start of the request that wrote or last read it. Every hit resets the clock, so a loop that keeps calling stays warm indefinitely. A loop that waits on a human, or a tool that takes six minutes, comes back to a cold cache and pays the write again. I checked this on a 21,532-token prefix: a read 30 seconds after the write was a full hit; after six idle minutes the same request wrote all 21,532 tokens again and read nothing. There is a one-hour option, at twice the normal input price to write instead of 1.25×, which pays off when the gaps between requests are between five minutes and an hour, and not otherwise.
A prefix below the model’s minimum. The Haiku case from the previous section. Nothing is wrong with the request; the model just won’t create an entry under 4,096 tokens, and the usage fields are the only place that shows.
This isn’t only my finding. A larger study, Don’t Break the Cache, ran over 500 agent sessions across OpenAI, Anthropic and Google and found the same two things at scale: 41–80% cost cuts when caching is structured well, and dynamic content placed anywhere but the end undoing it. What the per-turn fields above add is the shape of the failure, turn by turn, so you can recognise it in your own logs in one glance.
One detail that makes my numbers conservative: runs two and three of each cached arm started with the 1,469-token prefix of tools, system prompt and task message already in cache from the previous run. That’s what production looks like too. Every session of the same agent shares that prefix, so across a fleet it’s written once and read thousands of times.
Lever 2: lower the effort once output is the bill
Look at the cache-on row again. Of its $0.080, $0.055 is output tokens. Once the re-reading is cheap, what the model writes is 68% of the bill, and on current models most of what it writes is thinking. That’s what the effort setting controls, which makes effort the second lever, and useless as the first: cutting output by a third on an uncached run saves about an eighth of the bill, while caching saves nearly half.
I ran the cached harness again with one setting changed, effort: "low" in place of Opus 5.5’s default of medium:
| Model, effort | Caching | Pass | Turns | Tool calls | Output tokens | $ per task |
|---|---|---|---|---|---|---|
| Opus 5.5, medium (default) | on | 3/3 | 7.3 | 12.7 | 2,733 | $0.080 |
| Opus 5.5, low | on | 3/3 | 5.0 | 7.0 | 1,941 | $0.058 |
Low effort was 28% cheaper, and not only because the model thought less. It took five turns instead of seven and seven tool calls instead of thirteen: fewer verification laps, less narration between calls, and the same correct script at the end. Chained with caching, the task went from $0.150 to $0.058, a 62% cut, with nine passes in nine runs and no change to the agent’s code beyond two lines and one setting.
The caveat is the task. This one is simple enough that high bought nothing either, measured when Opus 5.5 launched. On a task where low starts failing, each failure costs a retry at the next level up, and the arithmetic has to include it. Anthropic’s cost-optimization docs describe the same policy on a SWE-bench Pro subset with Opus 5.5: run everything at low, re-run the 13% that fail at high, and about 97% pass for about $0.17 a task, against 95.3% for $0.29 running everything at high. That only works with a check the harness can run itself, the verifier from the agent loop essay. Measure yours; don’t assume.
Lever 3: pick the model by cost per solved task
The last lever is the one most people reach for first: a cheaper model. It’s last here because the first two levers change what “cheaper” means. I swapped Opus 5.5 for Haiku 4.5 with everything else held constant, with and without caching:
| Model | Caching | Pass | Turns | Tool calls | Output tokens | $ per task |
|---|---|---|---|---|---|---|
| Opus 5.5, low effort | on | 3/3 | 5.0 | 7.0 | 1,941 | $0.058 |
| Haiku 4.5 | off | 3/3 | 9.3 | 9.0 | 1,960 | $0.081 |
| Haiku 4.5 | on | 3/3 | 11.0 | 11.0 | 2,660 | $0.038 |
Haiku was cheapest per task, and only because the harness kept it on rails. Cached, Haiku solved the task for $0.038, the lowest number in this essay. Uncached, it cost $0.081, the same as cached Opus 5.5 at default effort, because it took more turns and read more. Its tokens are four times cheaper than Opus 5.5’s, and against Opus 5.5 at low effort its tasks were only one and a half times cheaper, since it needed twice the turns. It was also the least predictable arm: 6, 17 and 10 turns for three identical runs. In the context engineering essay, the same model on a similar task cost eight times more than Opus, because nothing stopped it reading a 167 KB file into the window. Caps fixed that; caching did the rest. A cheap model is cheap per task when, and only when, the harness holds the tokens down.
Two things to know before routing by price. Caches are per model, so a cascade that tries Haiku first and escalates to Opus pays the write premium twice and reads nothing across the switch. And the top model at low effort is often the cheaper comparison to make first: here it cost 50% more than Haiku per task and finished in half the turns on average.
What I didn’t test: the one-hour cache lifetime, the batch API’s 50% discount (it applies on top of cache reads, and it’s the obvious choice for evaluation runs and backfills that don’t wait on anyone), Sonnet 5, and the caching schemes on OpenAI and Gemini, which have the same shape with different minimums and discounts. All of these runs stayed under 20 turns; the ordering penalty grows with the square of the session, so at 50 turns the gap between the top and tail arms is far wider than 2×.
A cost checklist for your harness
In the order the levers pay off:
- Cache the prefix. One breakpoint on the system prompt, plus the automatic one for the conversation. Two lines.
- Read the usage fields, per turn, in a test. The second request of any session must read more than zero. A broken cache costs more than none, and only these fields say so.
- Put what changes last. Timestamps, request IDs, user names, mode lines: the tail of the newest message, never the front of the system prompt.
- Keep the tool list and the model fixed for the session. Fixed order, fixed membership. Pass modes as message content. Escalating to another model means a cold cache; start a new session and accept it.
- Match the cache lifetime to the gaps. Under five minutes between requests, the default. Five minutes to an hour, the one-hour lifetime at 2× to write. Longer, nothing helps.
- Check the model’s minimum. 512 tokens on Opus 5 and 5.5, 1,024 on Sonnet 5, 4,096 on Haiku 4.5. Under it, the breakpoint silently does nothing.
- Then lower the effort. Once caching works, output is the bill. Measure the pass rate at each level, pick the cheapest that holds, and run low first with retries where you have a check.
- Then pick the model, by cost per solved task. With retries counted and the turn count in view. A cheap model that needs twice the turns isn’t cheap.
- Cap tool results in code. The one lever that beats all of these, and the one I measured first, in the context engineering essay.
Nothing in this essay made the agent smarter. The same model wrote the same script and passed the same check in every one of the 21 runs. What changed was where a line sat in the prompt, one setting, and whether anyone had looked at three fields in the response. The bill went from $0.150 to $0.058. Harness work, all of it.